By utilizing Power BI and Lumiform, users can effortlessly transform their existing data into visually appealing graphics, resulting in maximum benefits.

The requirements for using Power BI in Lumiform:
To use Power BI in Lumiform, you need to meet two requirements.
First, you must have the Lumiform integrations set up and your Power BI account connected.
Second, the account you are logged in with in Power BI should also be used for authentication in the Lumiform app.
Once you meet these requirements, you can start using Power BI to evaluate your data. For more details on how to use Lumiform's integrations, you can refer to the article on Integrations & Marketplace.
Our guide offers a basic framework for importing and analyzing Lumiform datasets in Power BI. However, customization and advanced analysis will depend on your specific needs and goals.
A guide on setting up a Power BI database with Lumiform:
1. Create a new report: Open Power BI, go to the File menu, and select New to create a new report:
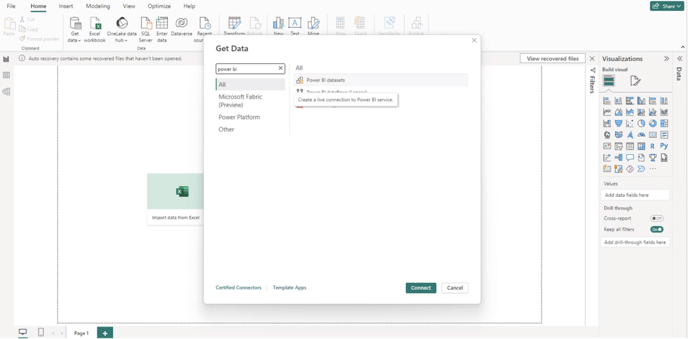
2. Get Data: Click the Get Data button in the main menu. In the dialog box, choose Power BI datasets as the data source type:
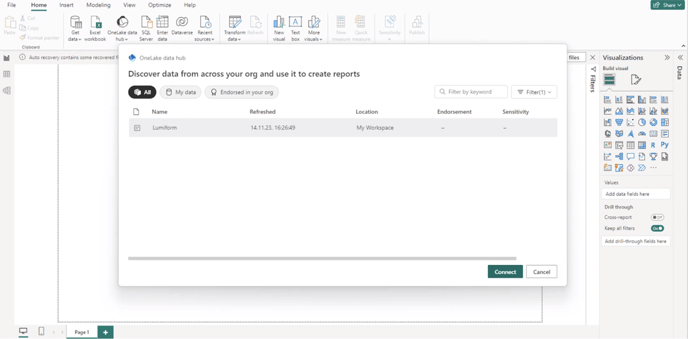
3. Select the Lumiform dataset: From the list of available data sources, select Lumiform. Click Connect to load the dataset into Power BI Desktop:
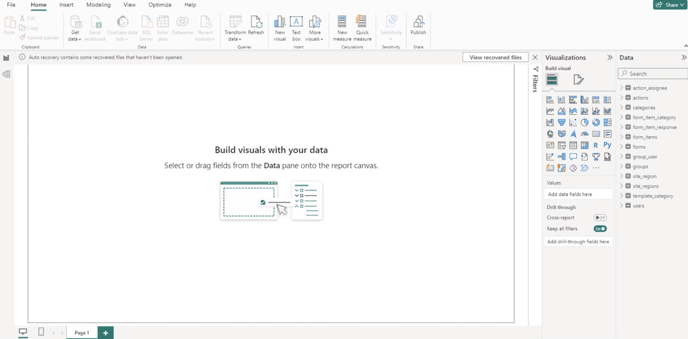
4. Access the Data Panel: Once connected, the Data panel will appear on the right side of the screen. This panel displays all the tables and fields available in the Lumiform data set:
5. Choose a visualization type: Go to the Visualizations section in the report view. Select the type of visualization you want to create, such as a bar chart, line chart, or pie chart:
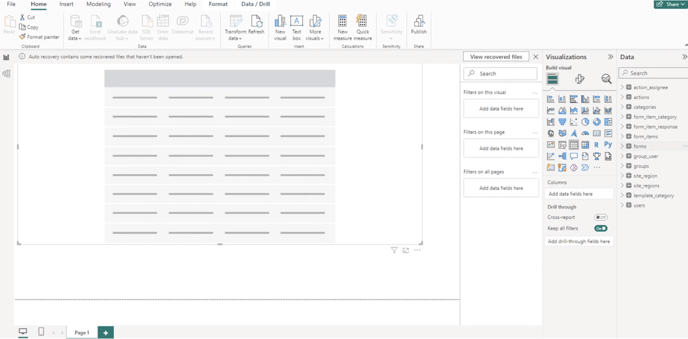
6. Add data to the visualization: In the data area, select the fields you want to visualize. These fields will be displayed in the visualization. Arrange them as needed to configure your visualization.